DataPulse: From Friday Spreadsheets to One Dashboard Every B2B Team Trusts
- Role
- Design Direction, End-to-end product design
- Client
- DataPulse
- Services
- Product Design, Web App, Design System
Every morning, growth teams asked one question - are we profitable? - and nobody could answer it before lunch. We made the answer the first thing they see.
Challenge
Sales, spend, and profit lived in five tabs and one spreadsheet someone updated on Fridays.
Approach
Start from the questions teams ask every morning, then build the dashboard around the answers.
The problem
What Was DataPulse Up Against?
D2C teams were drowning in tabs. Sales lived in Shopify, spend lived in ad platforms, and the answer to "are we profitable this month?" lived in a spreadsheet someone updated on Fridays.
By the time the numbers were clear, the budget was already spent. Every analytics tool on the market answered that with more charts. Nobody needed more charts - they needed a decision.
The approach
How Did We Approach It?
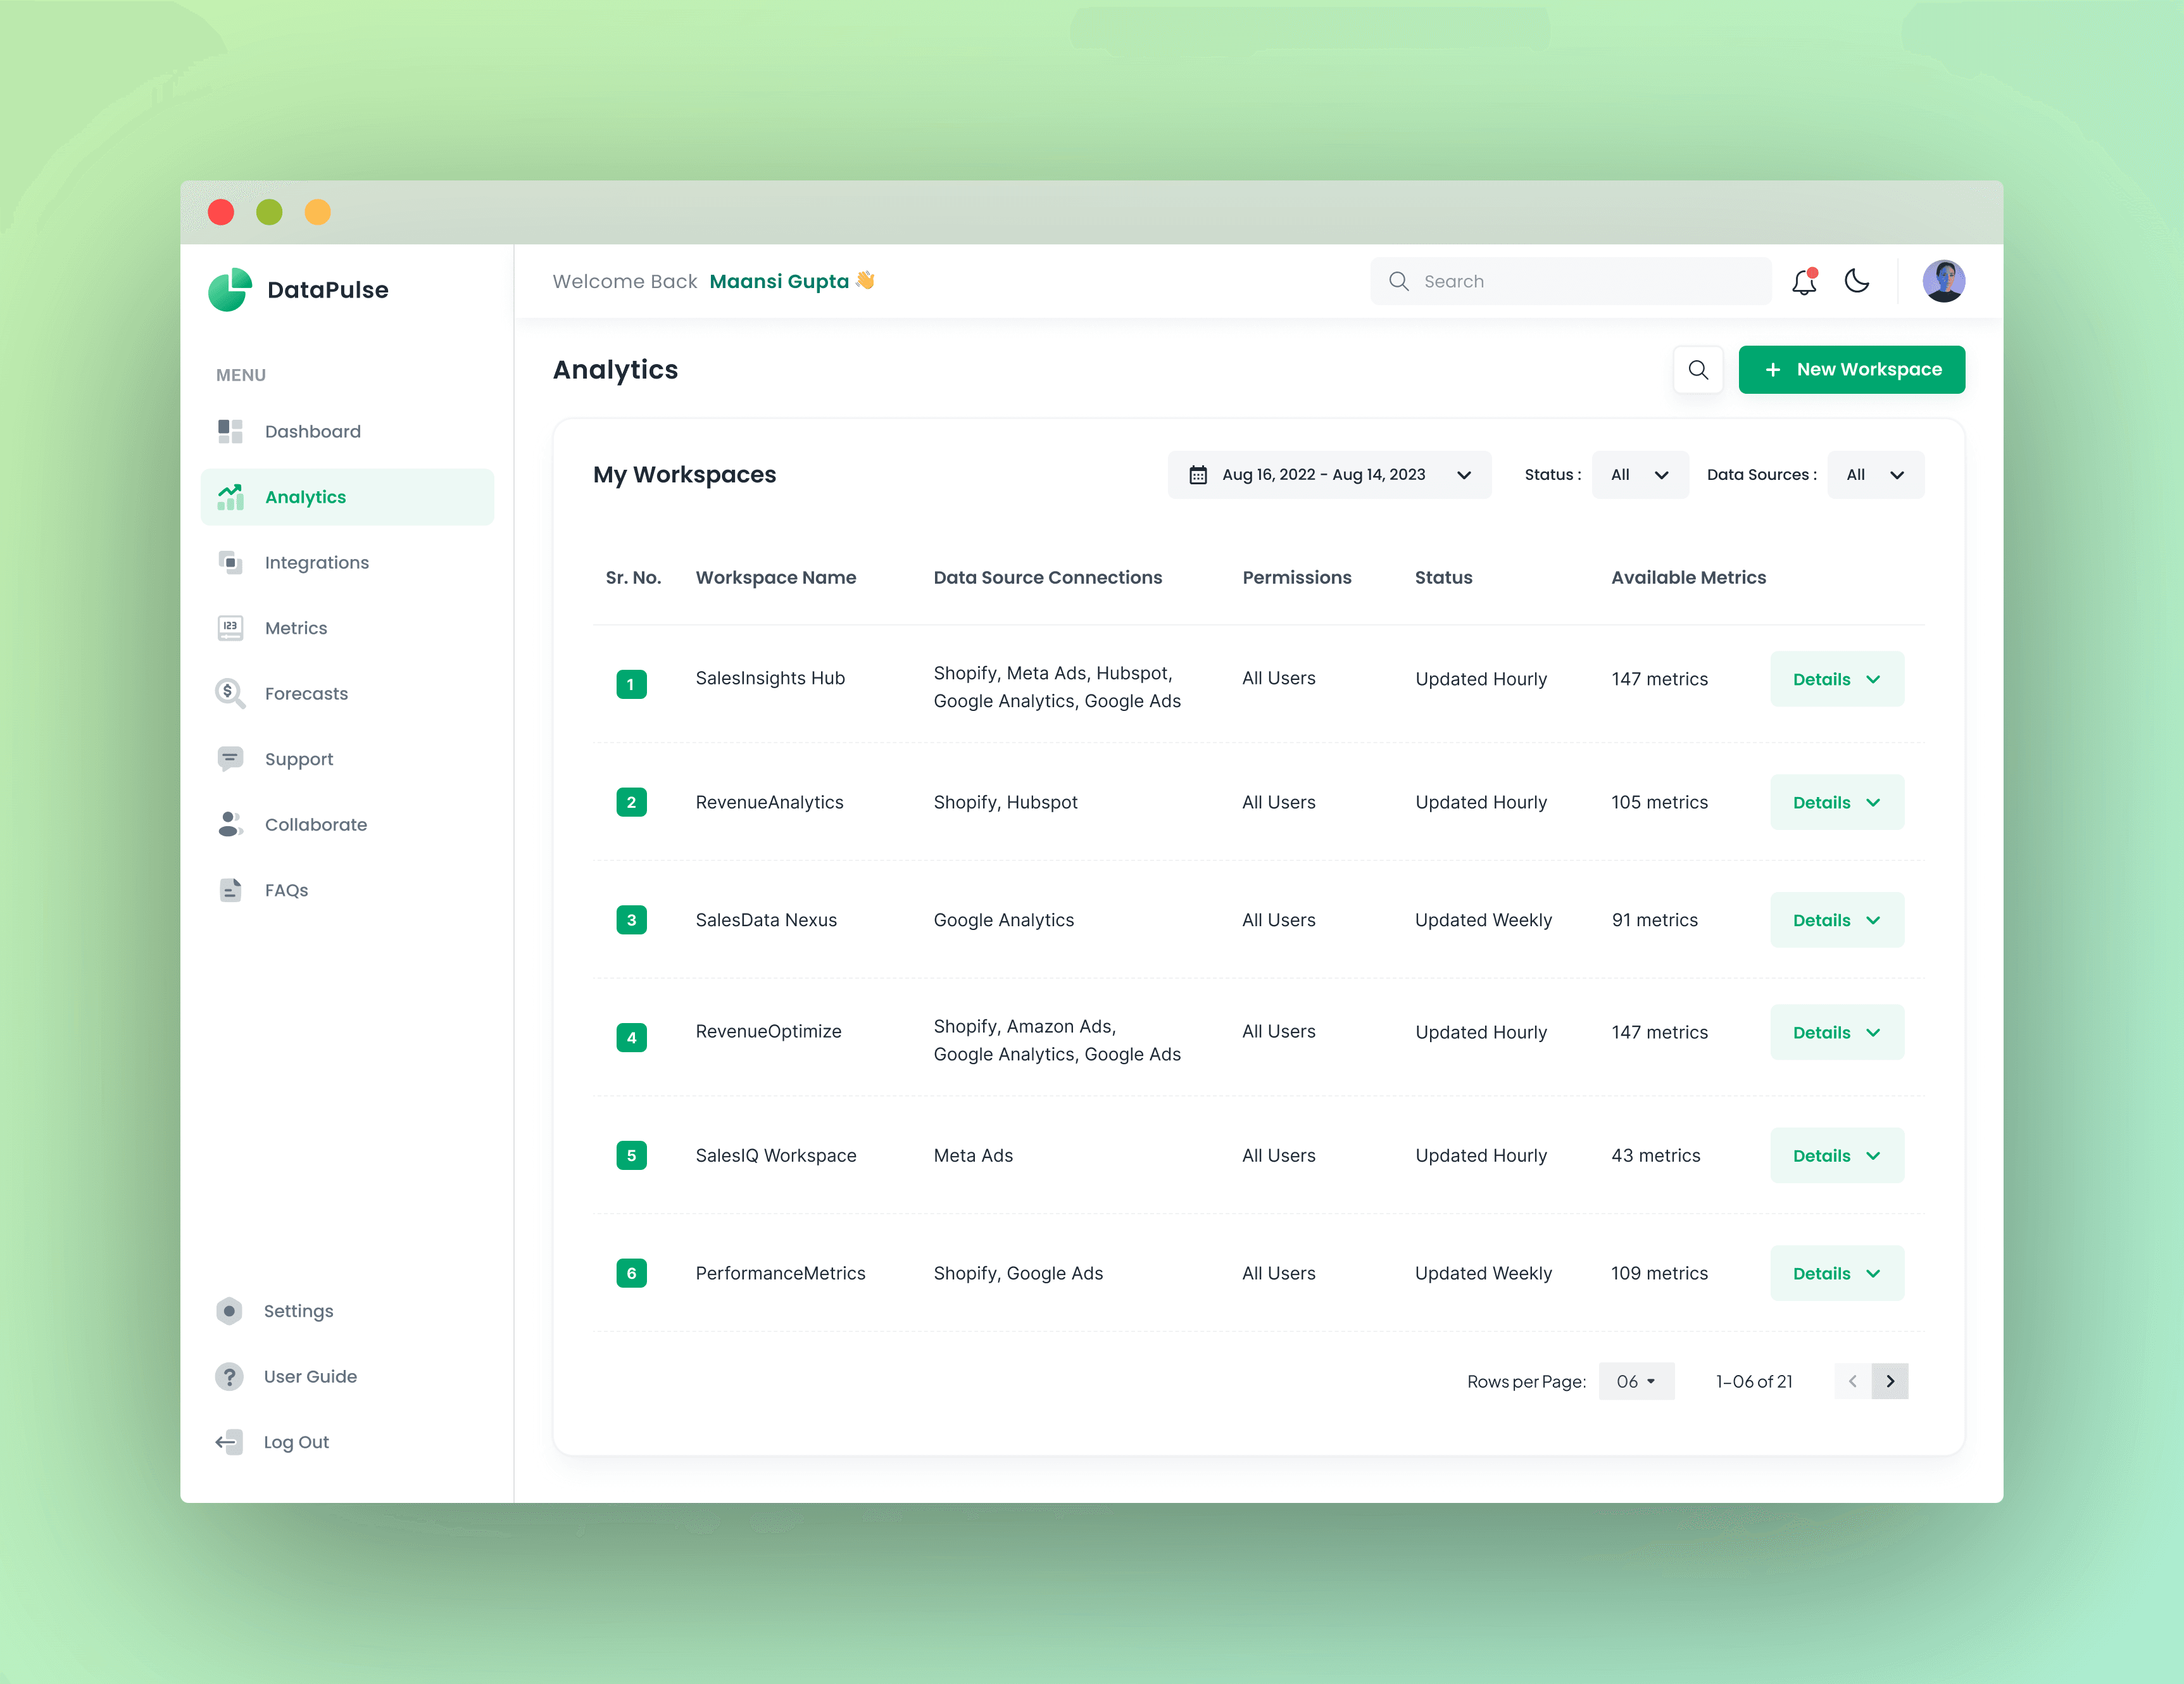
I started with the questions teams asked every morning, not the data they had. Those questions became the information architecture.
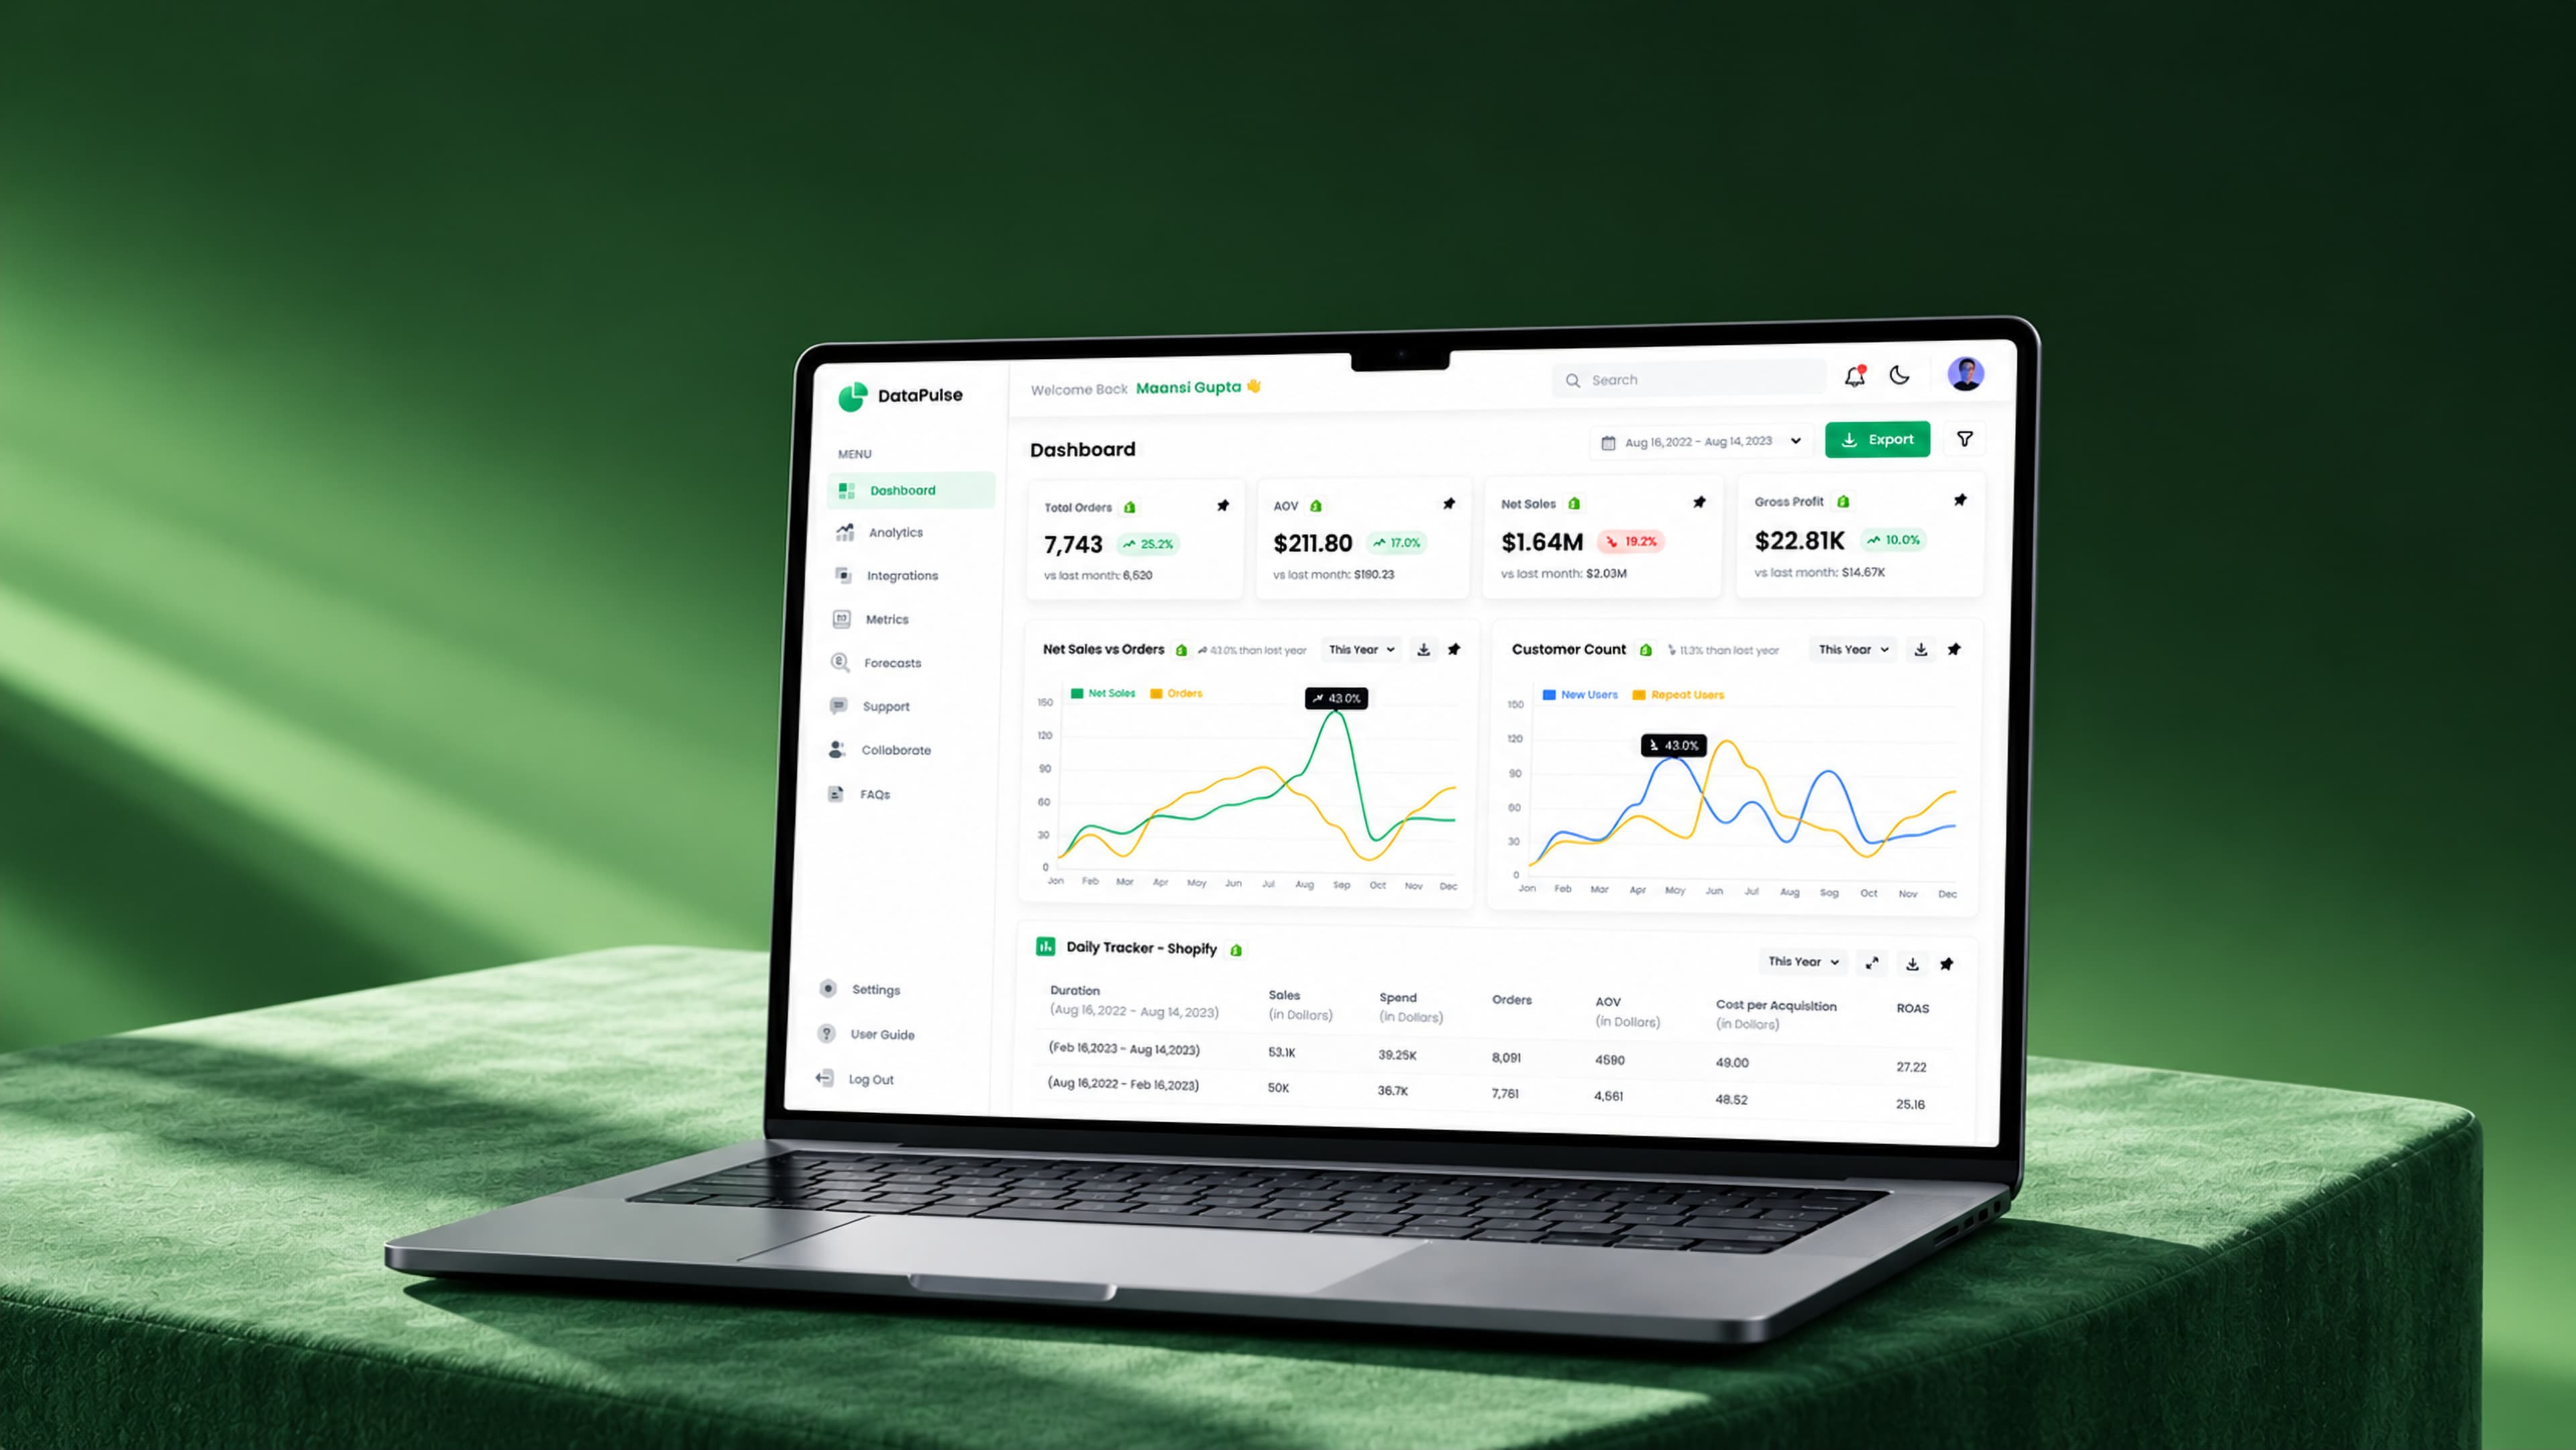
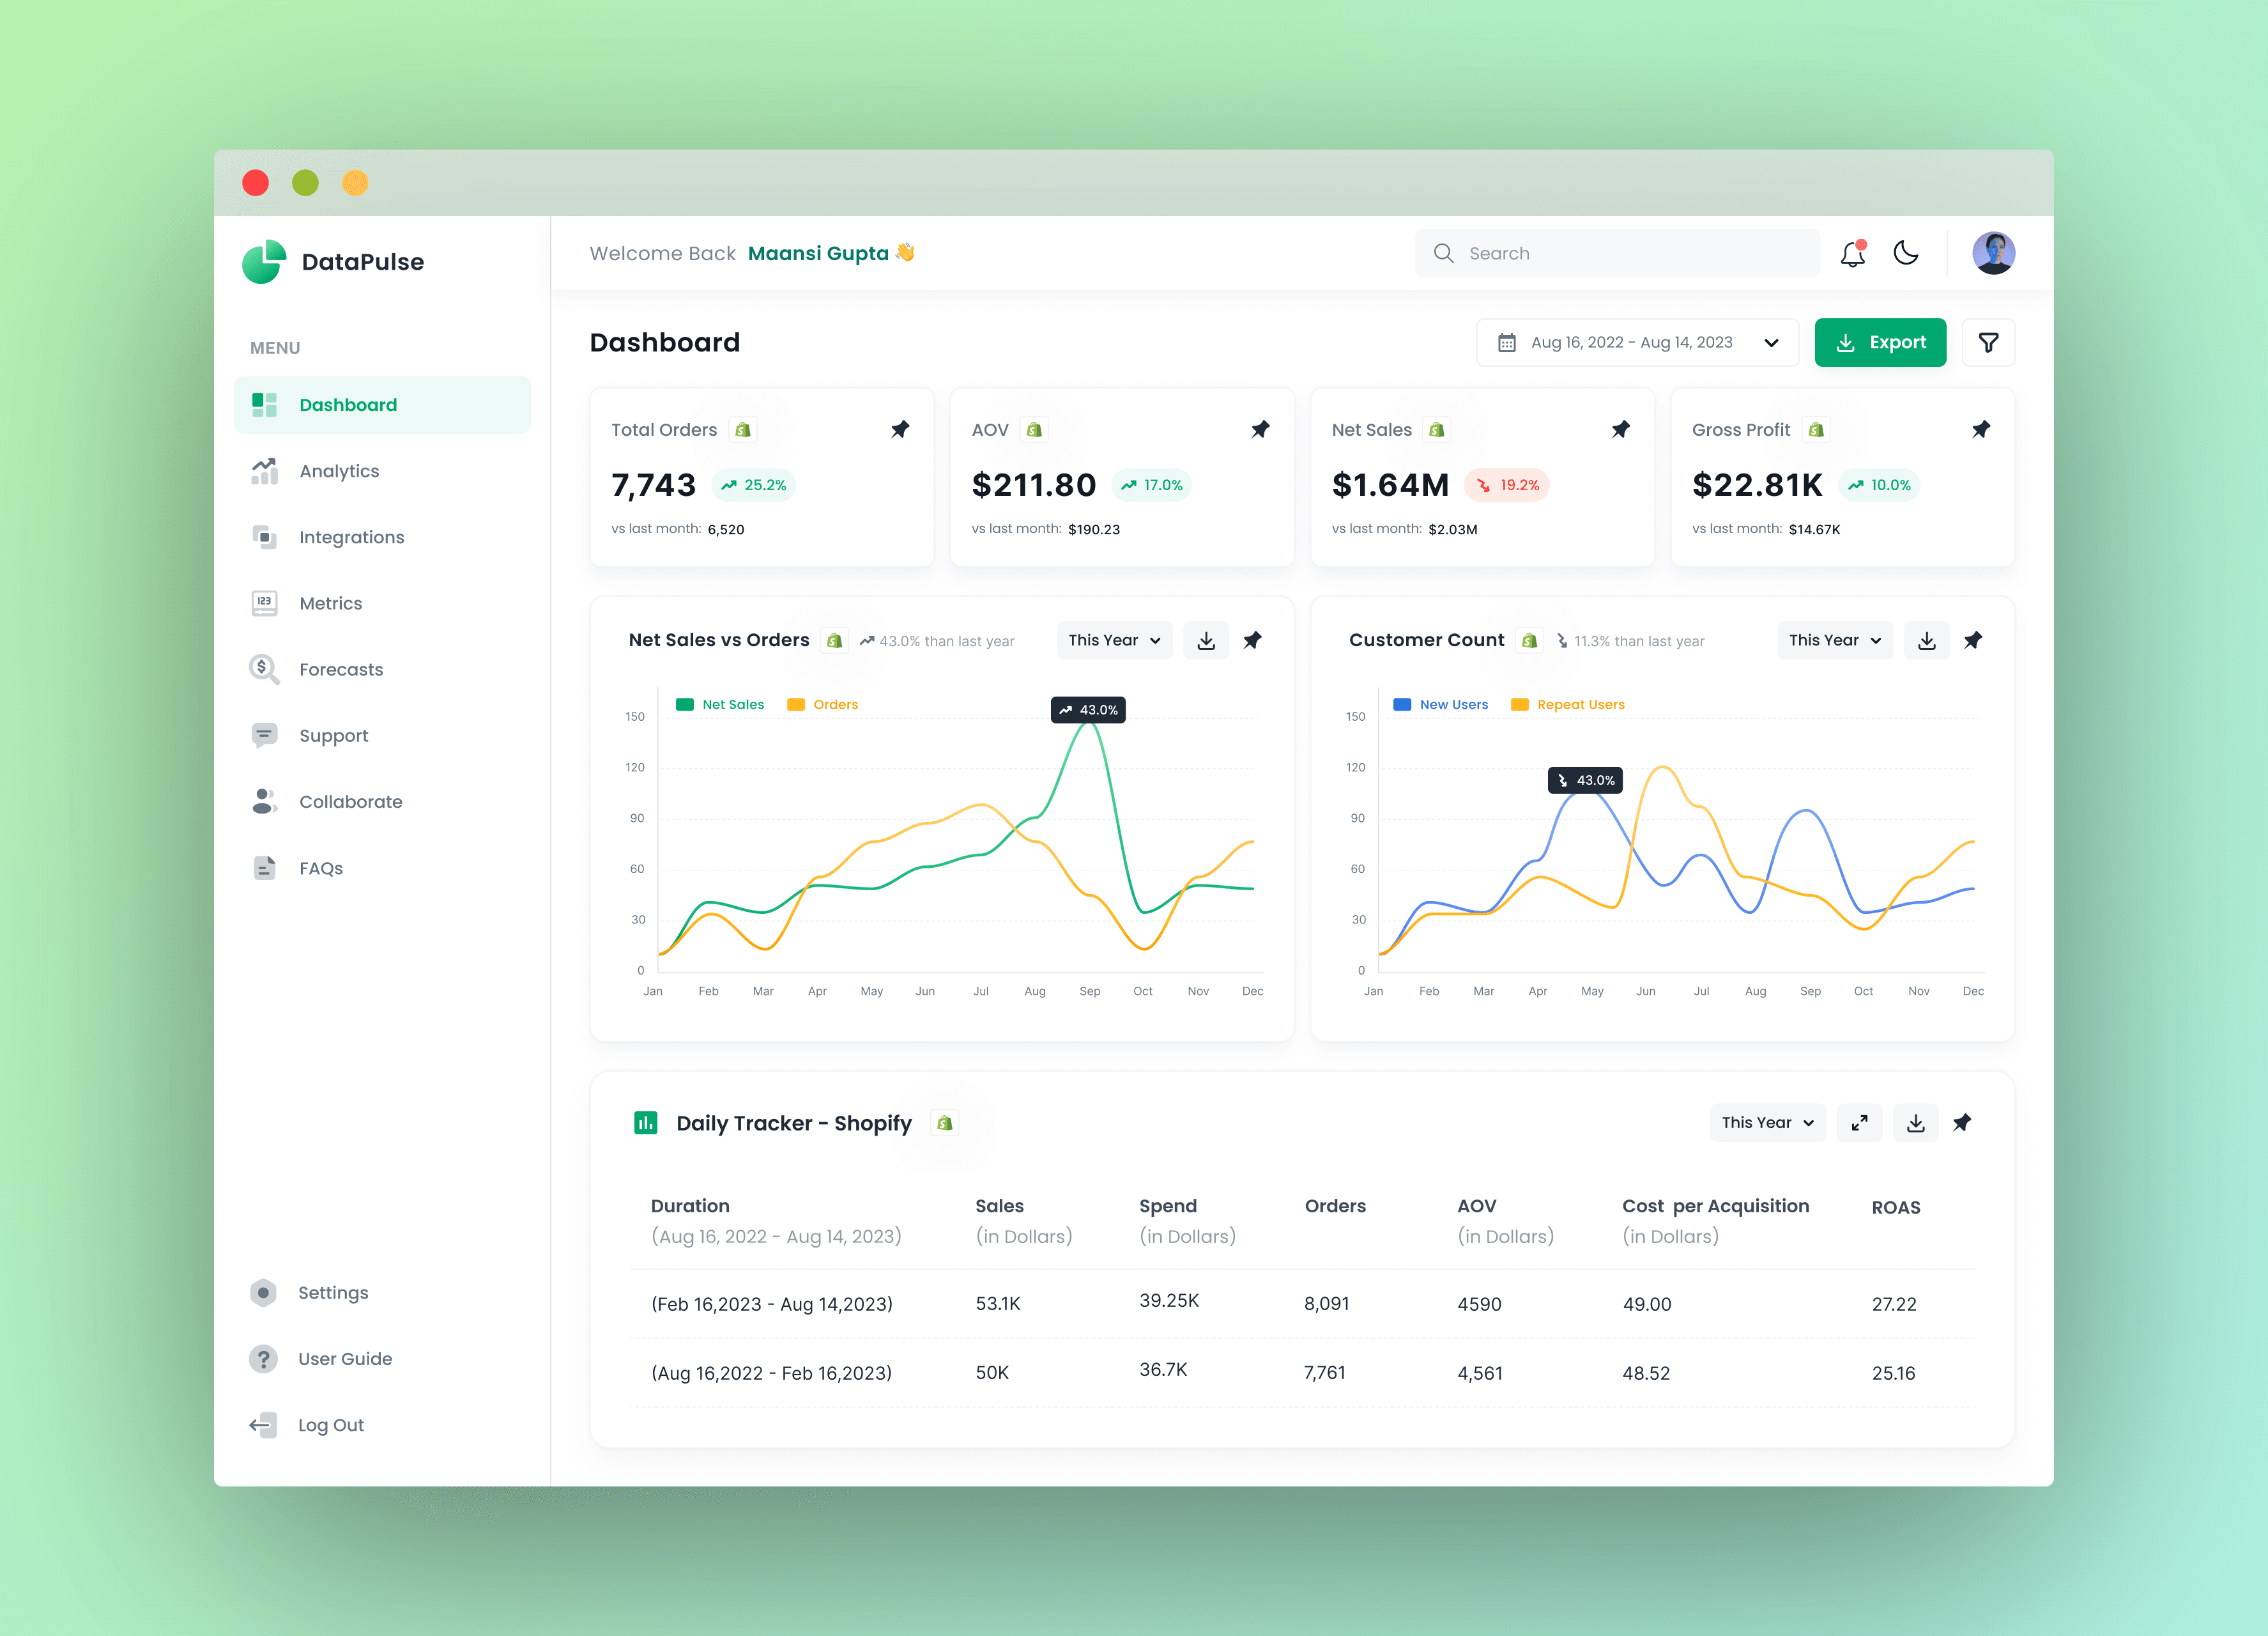
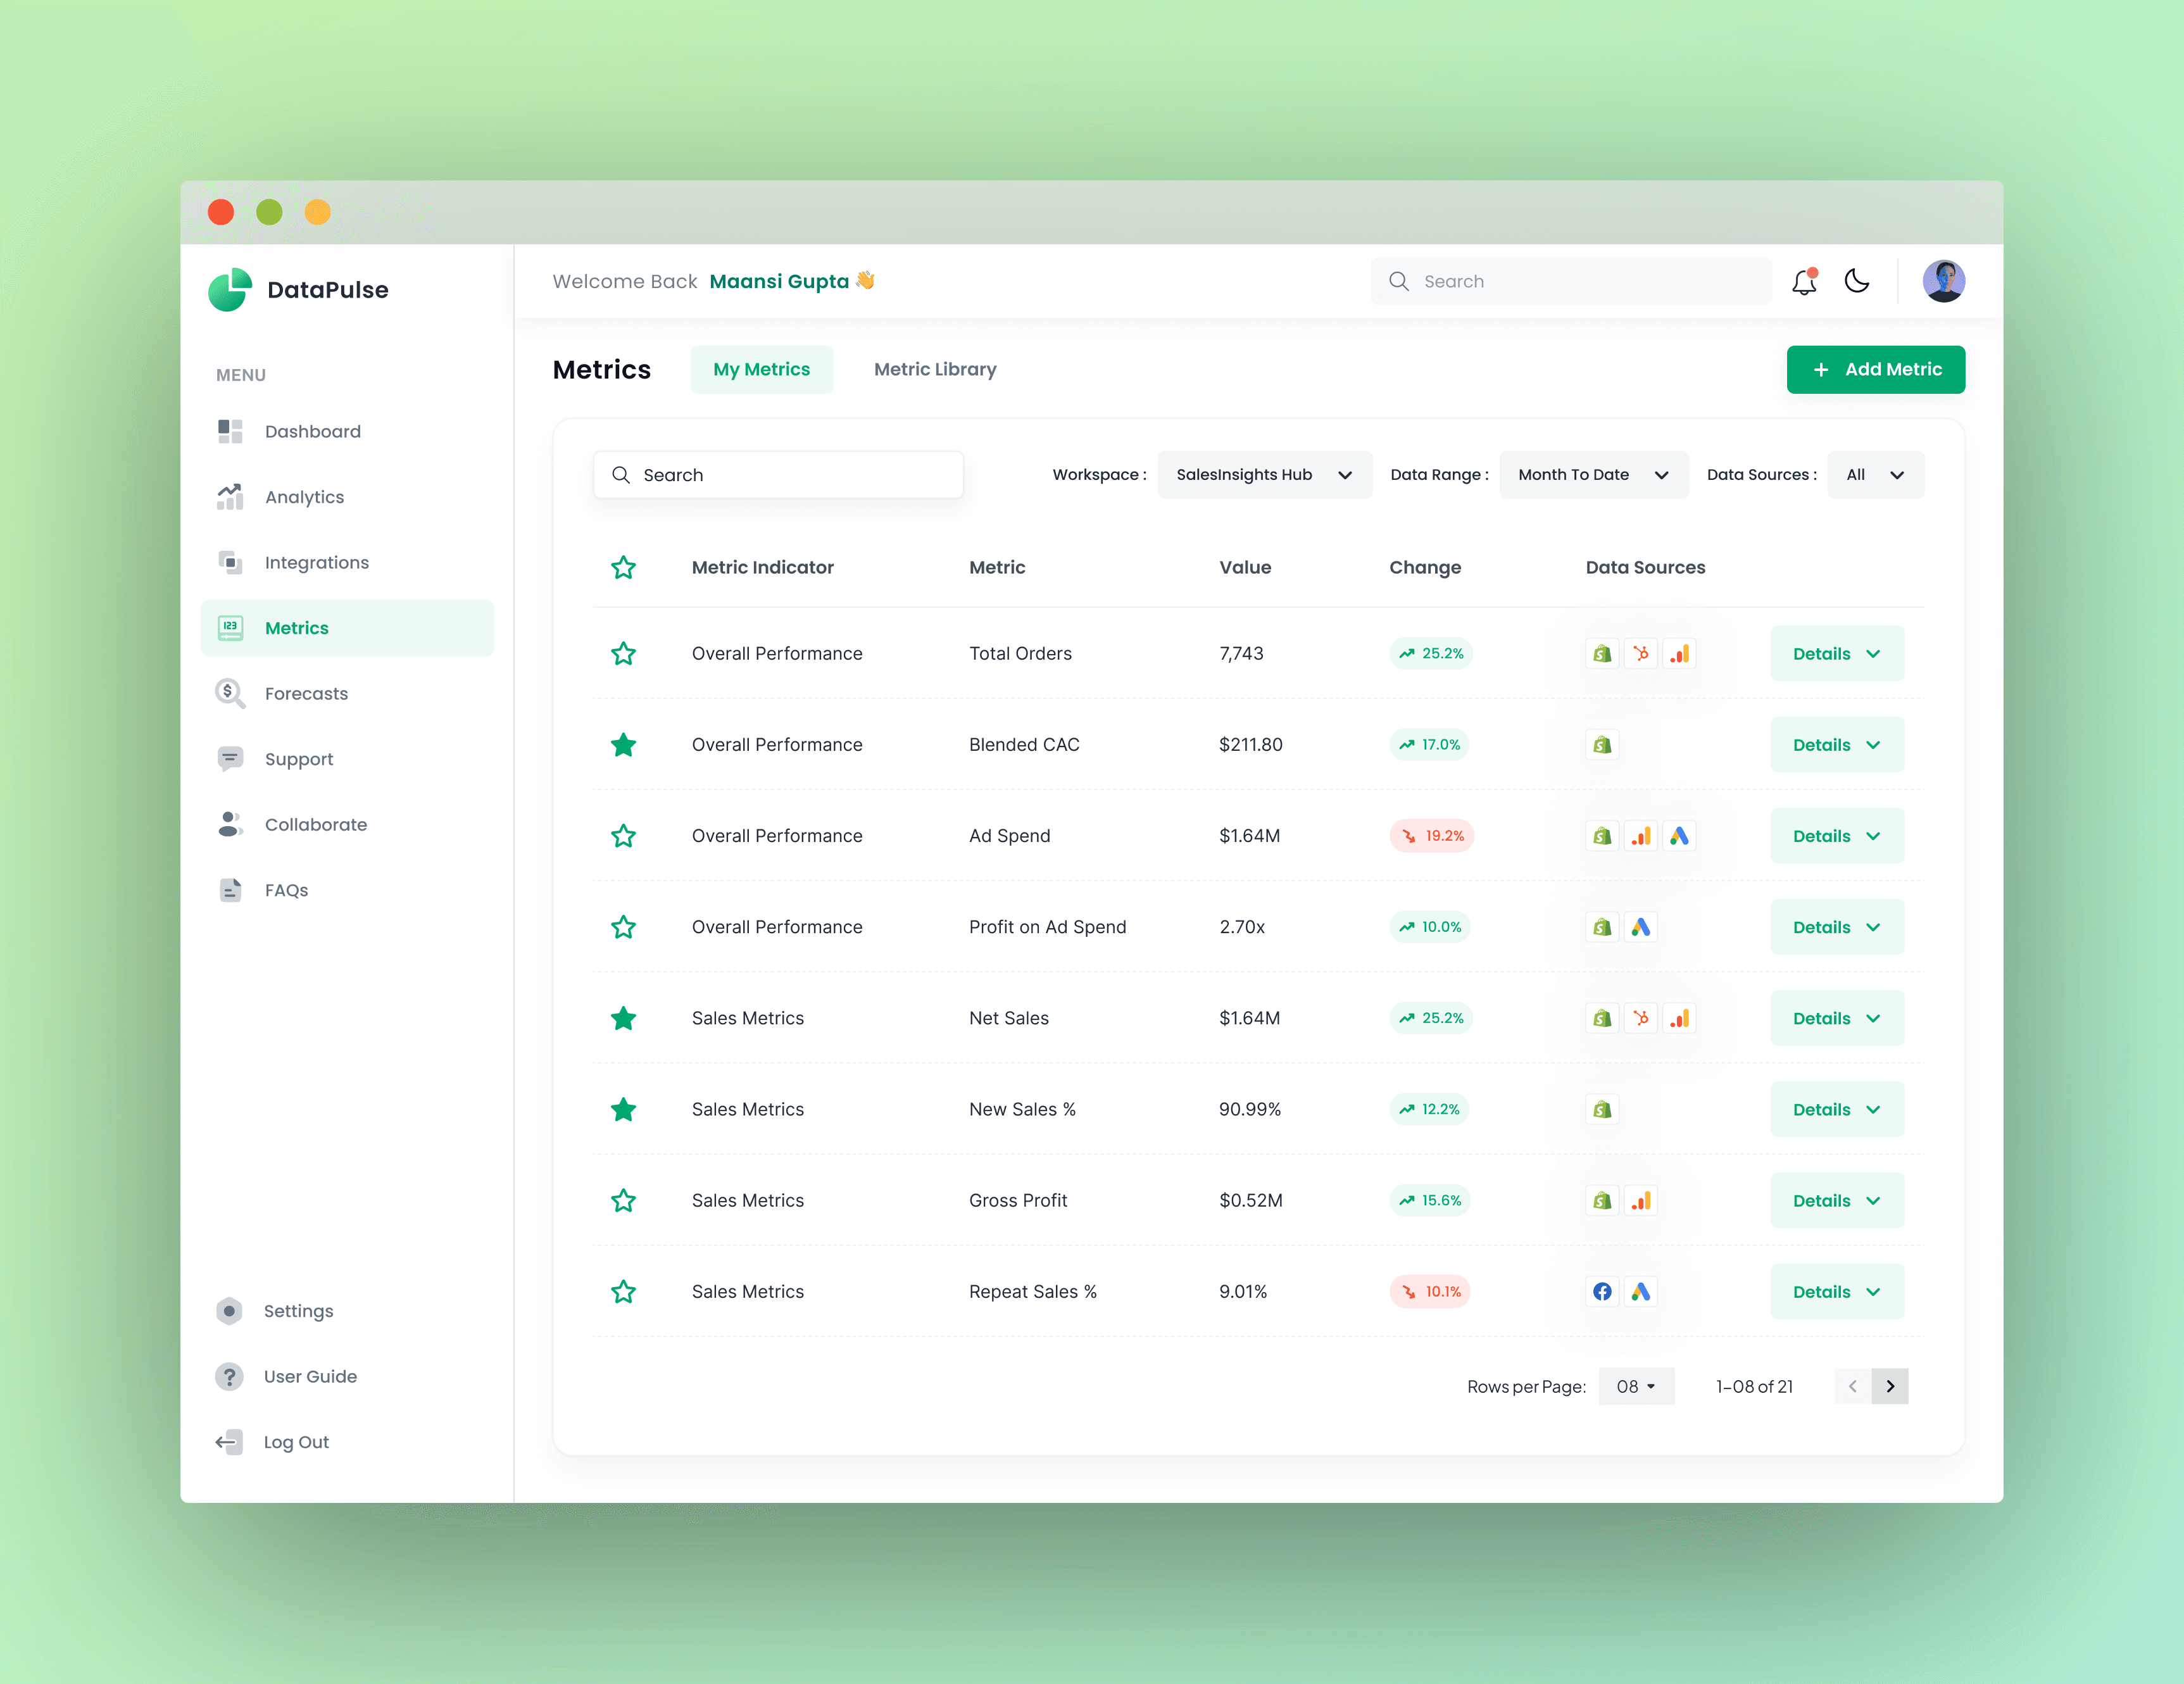
- 01Built the dashboard around the four numbers that decide a day - orders, AOV, net sales, and gross profit - each with trend context
- 02Designed comparative charts (net sales vs. orders, new vs. repeat customers) for spotting patterns, not decoration
- 03Pulled spend, CPA, and ROAS into one daily tracker you can scan in seconds
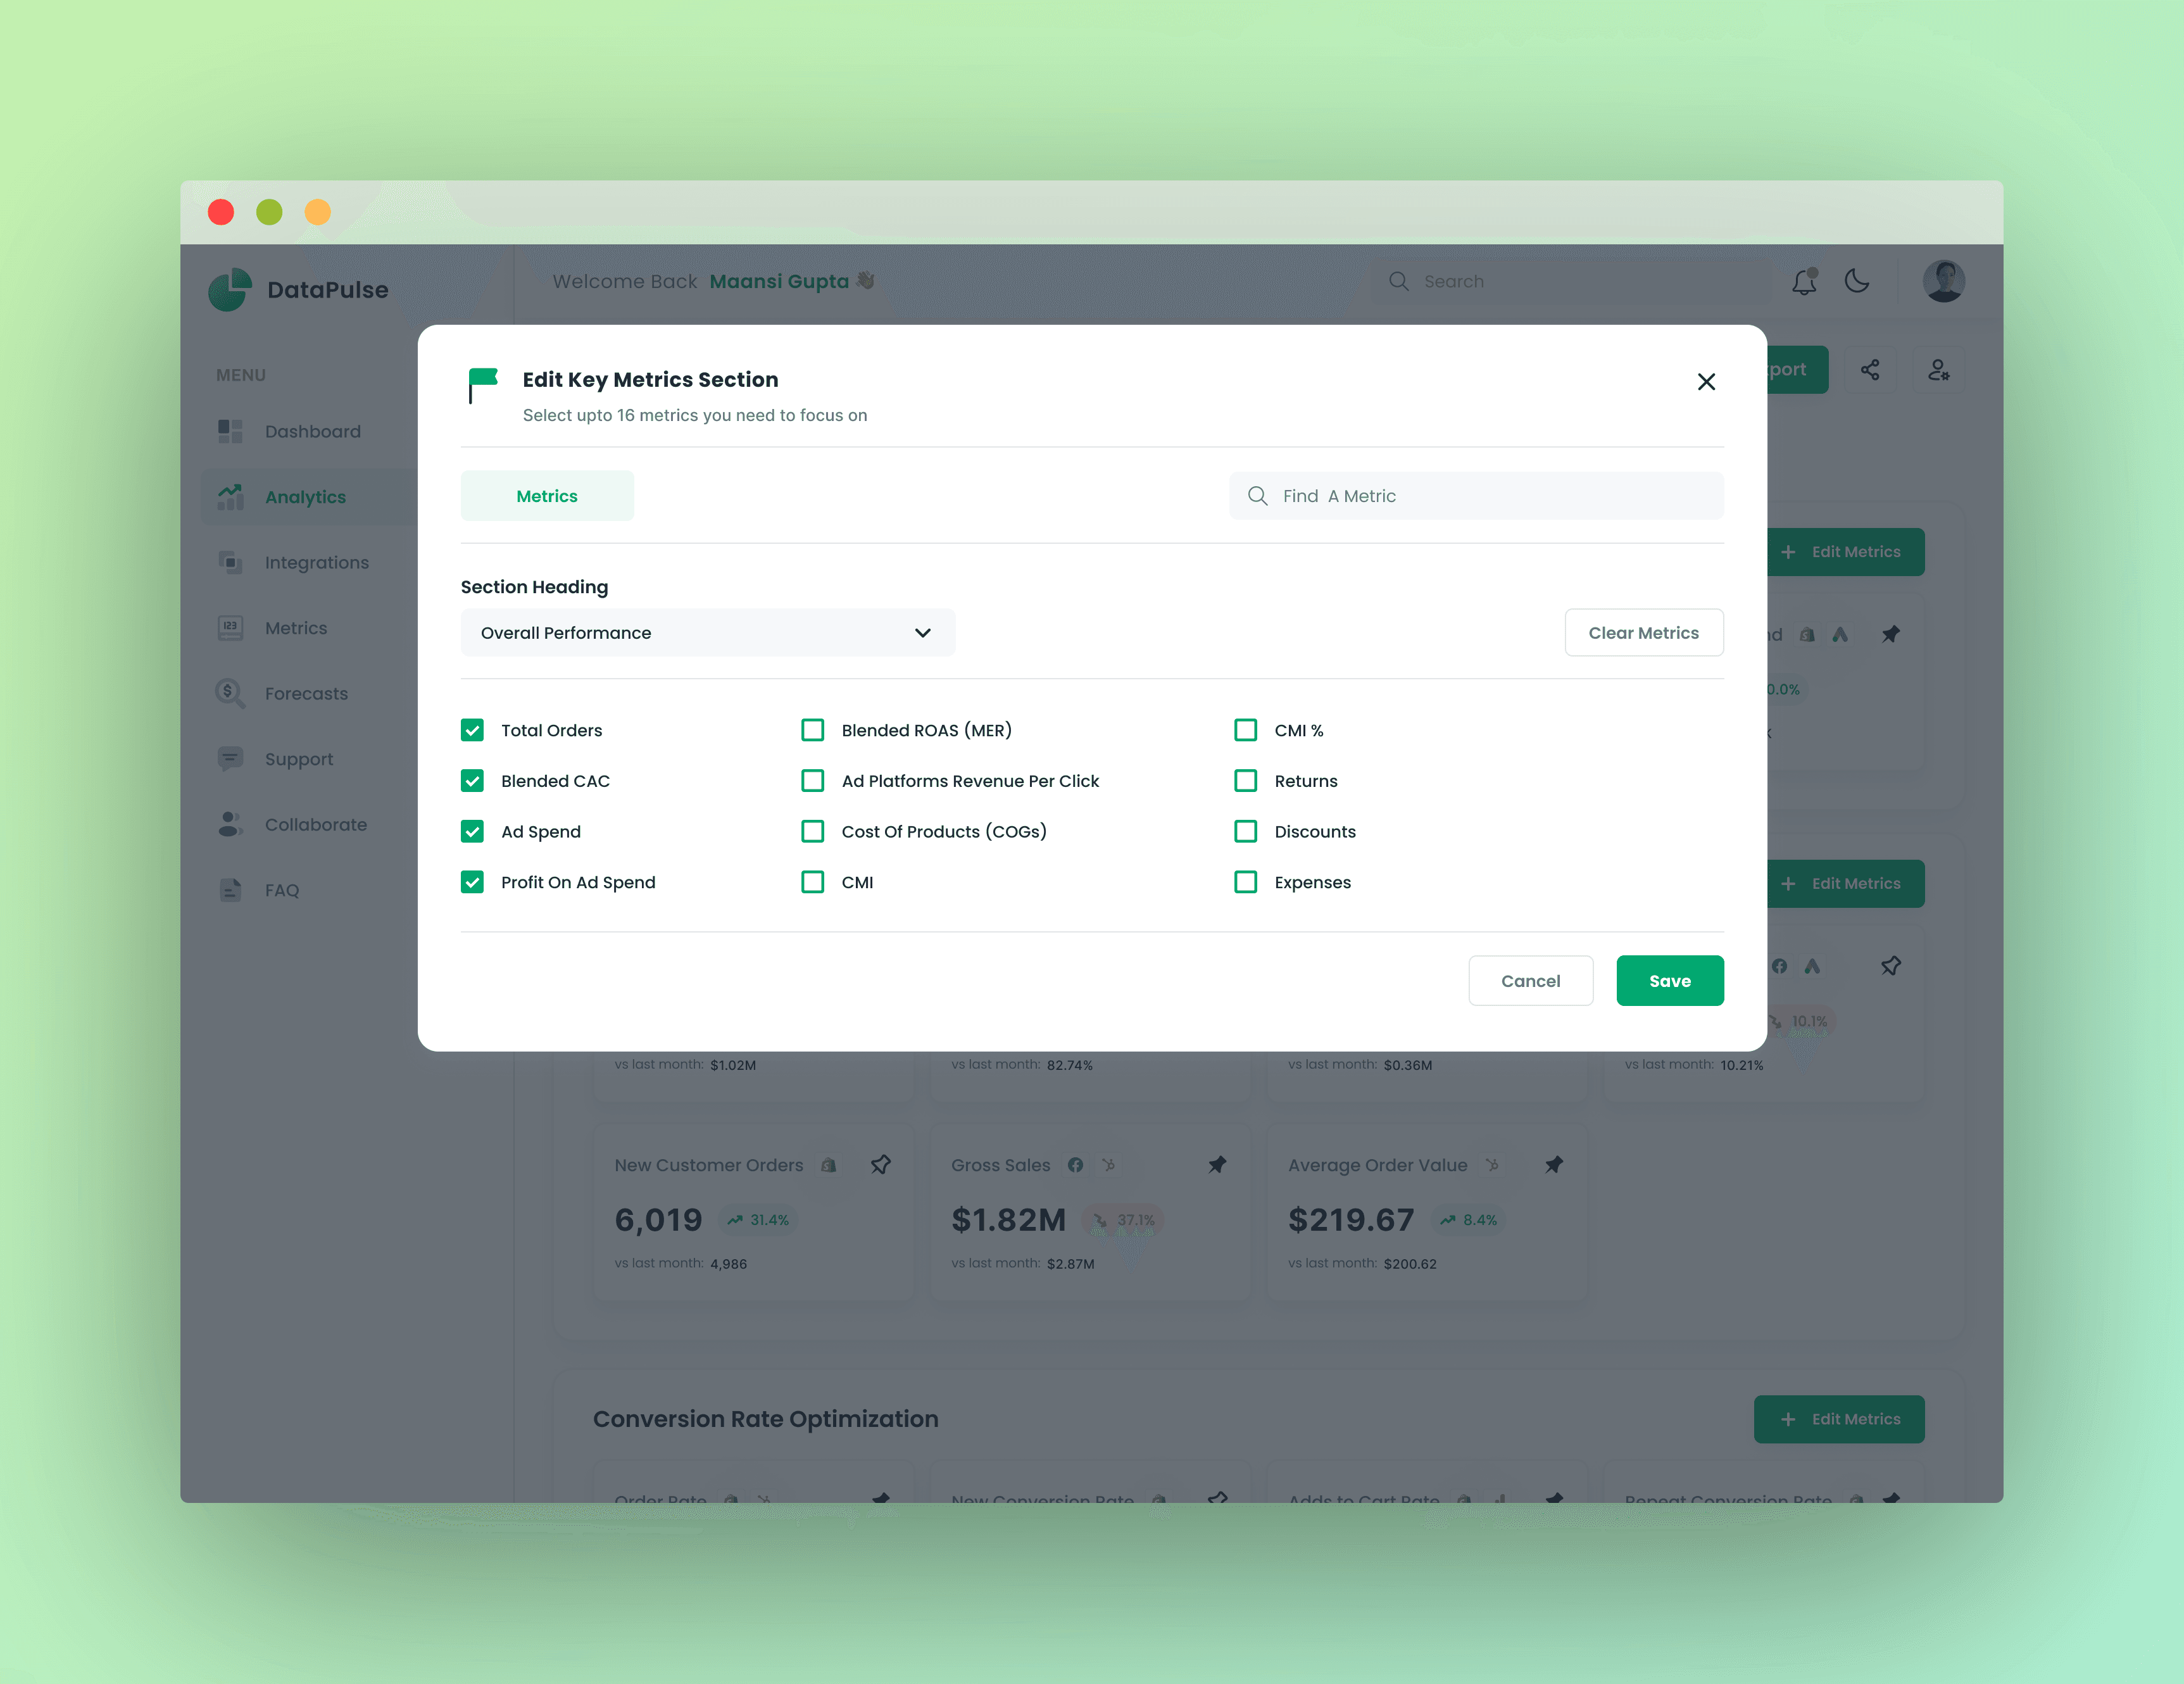
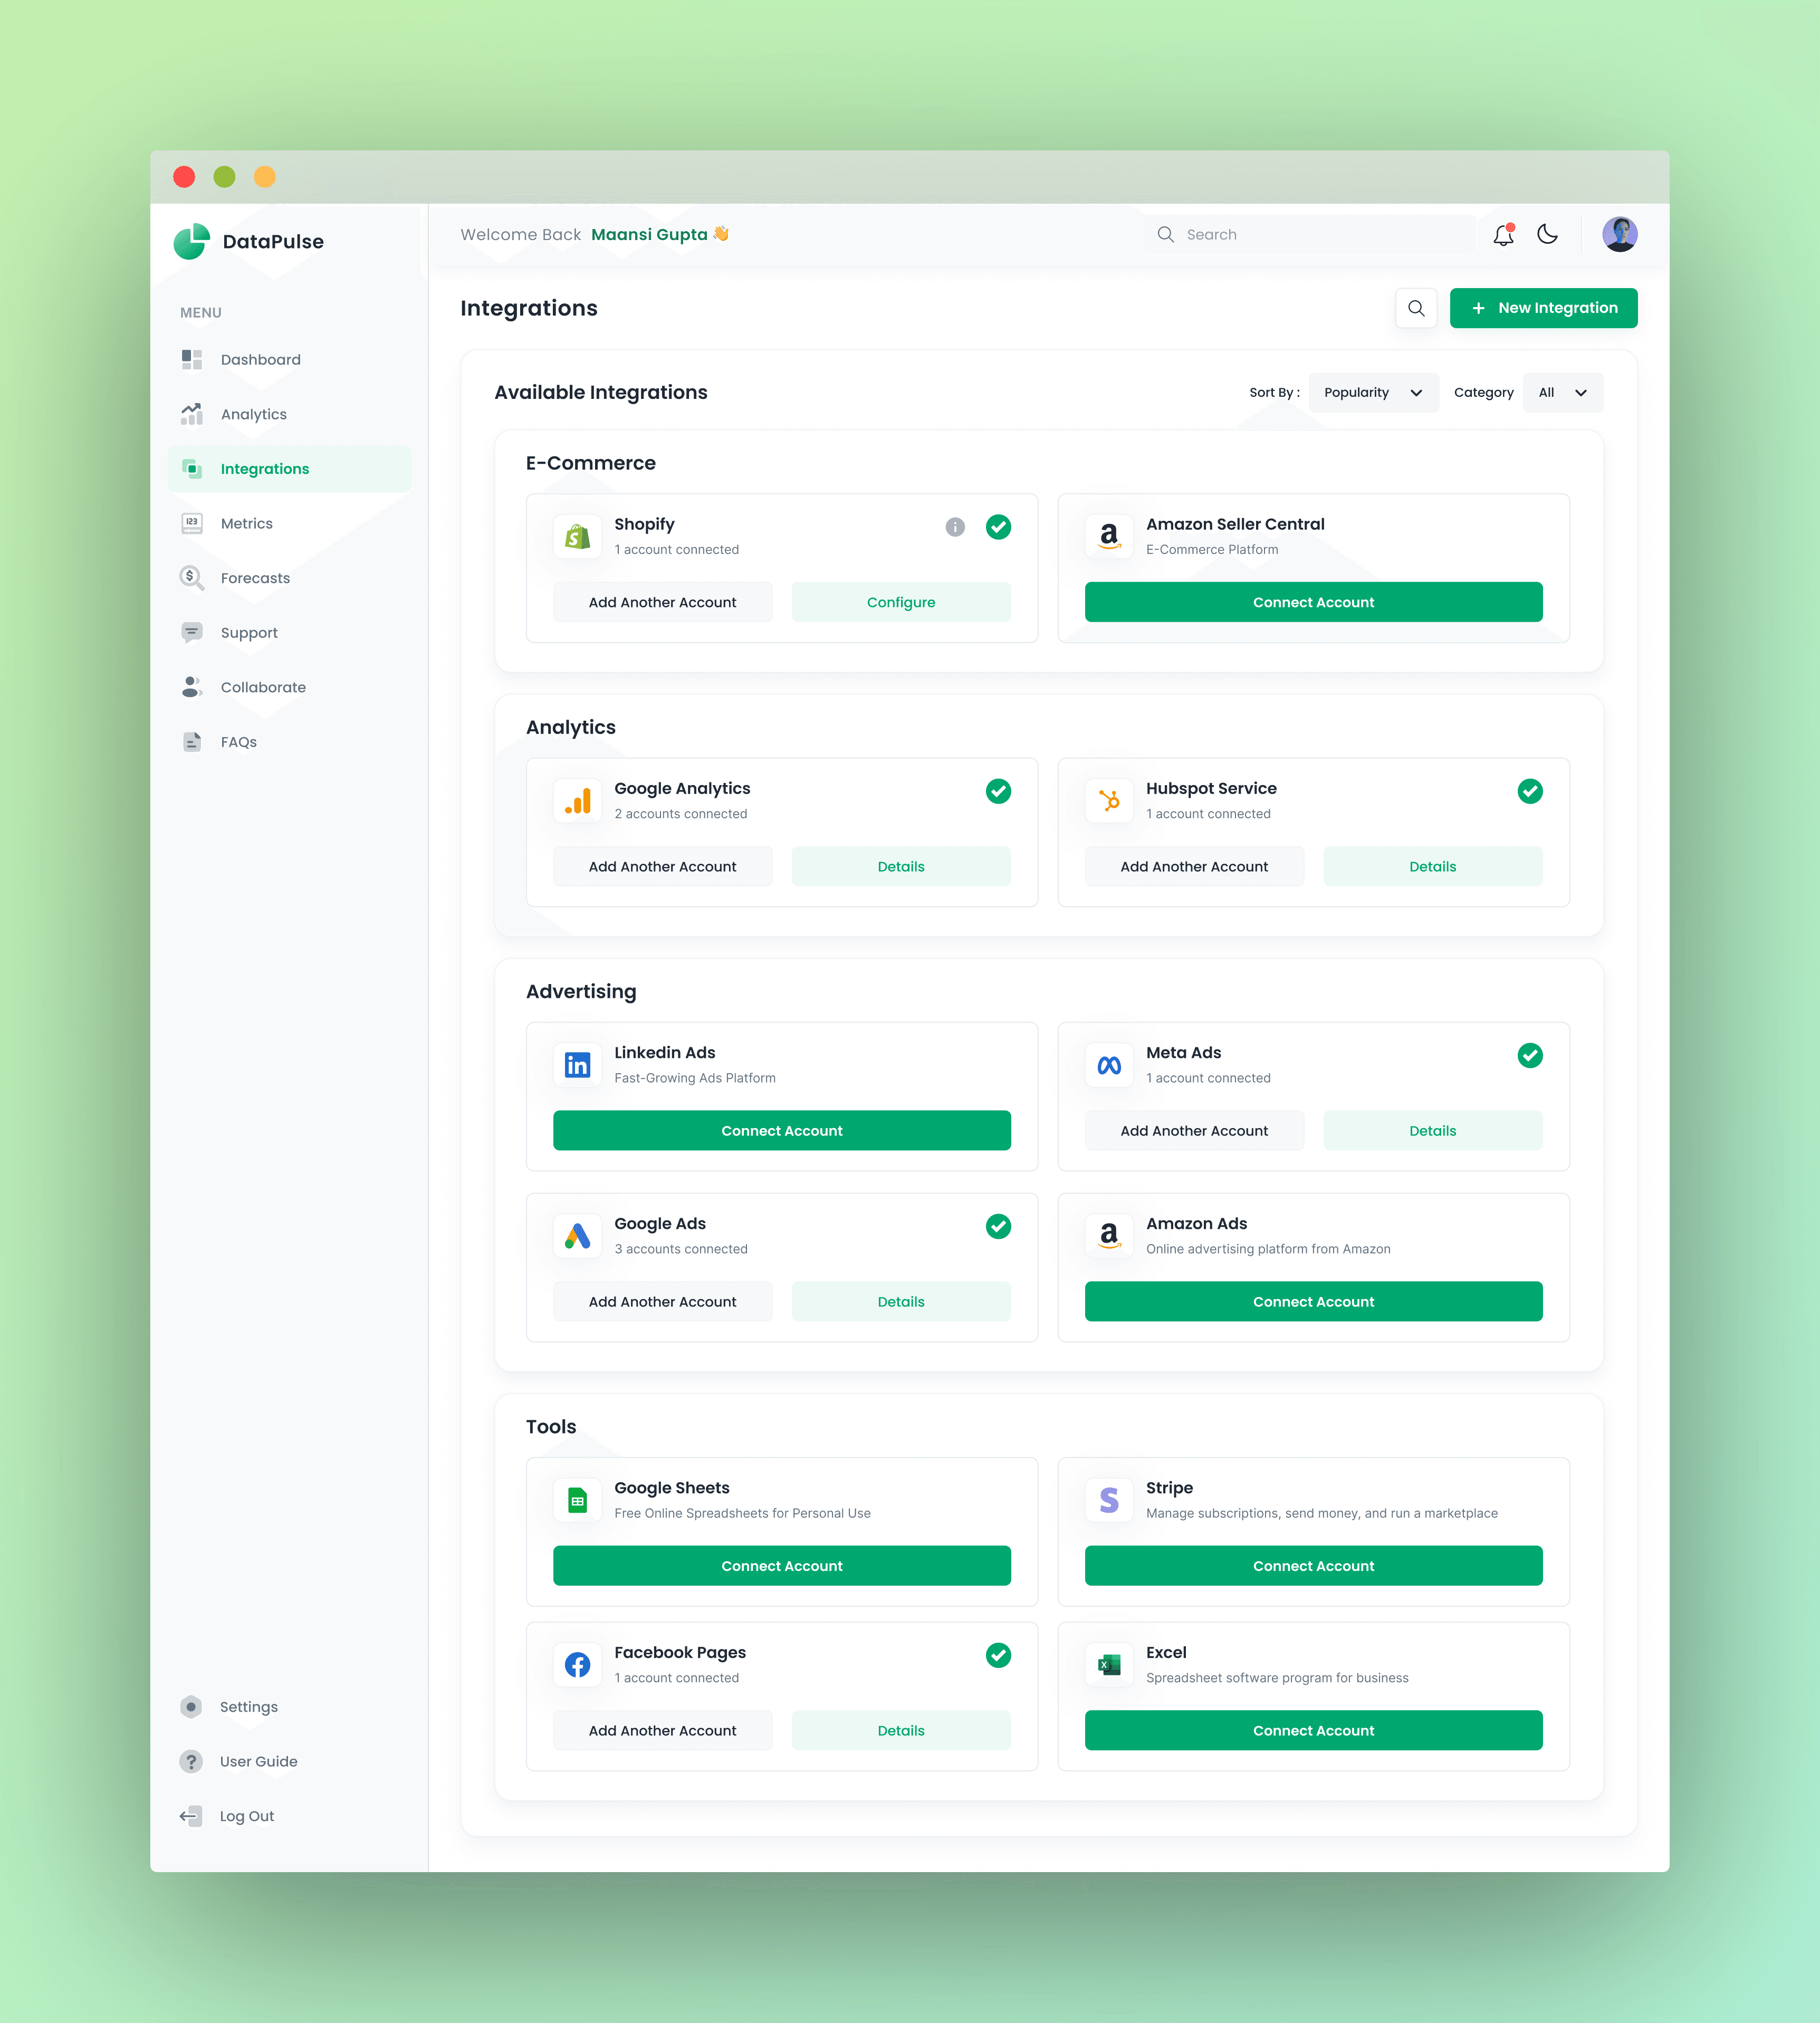
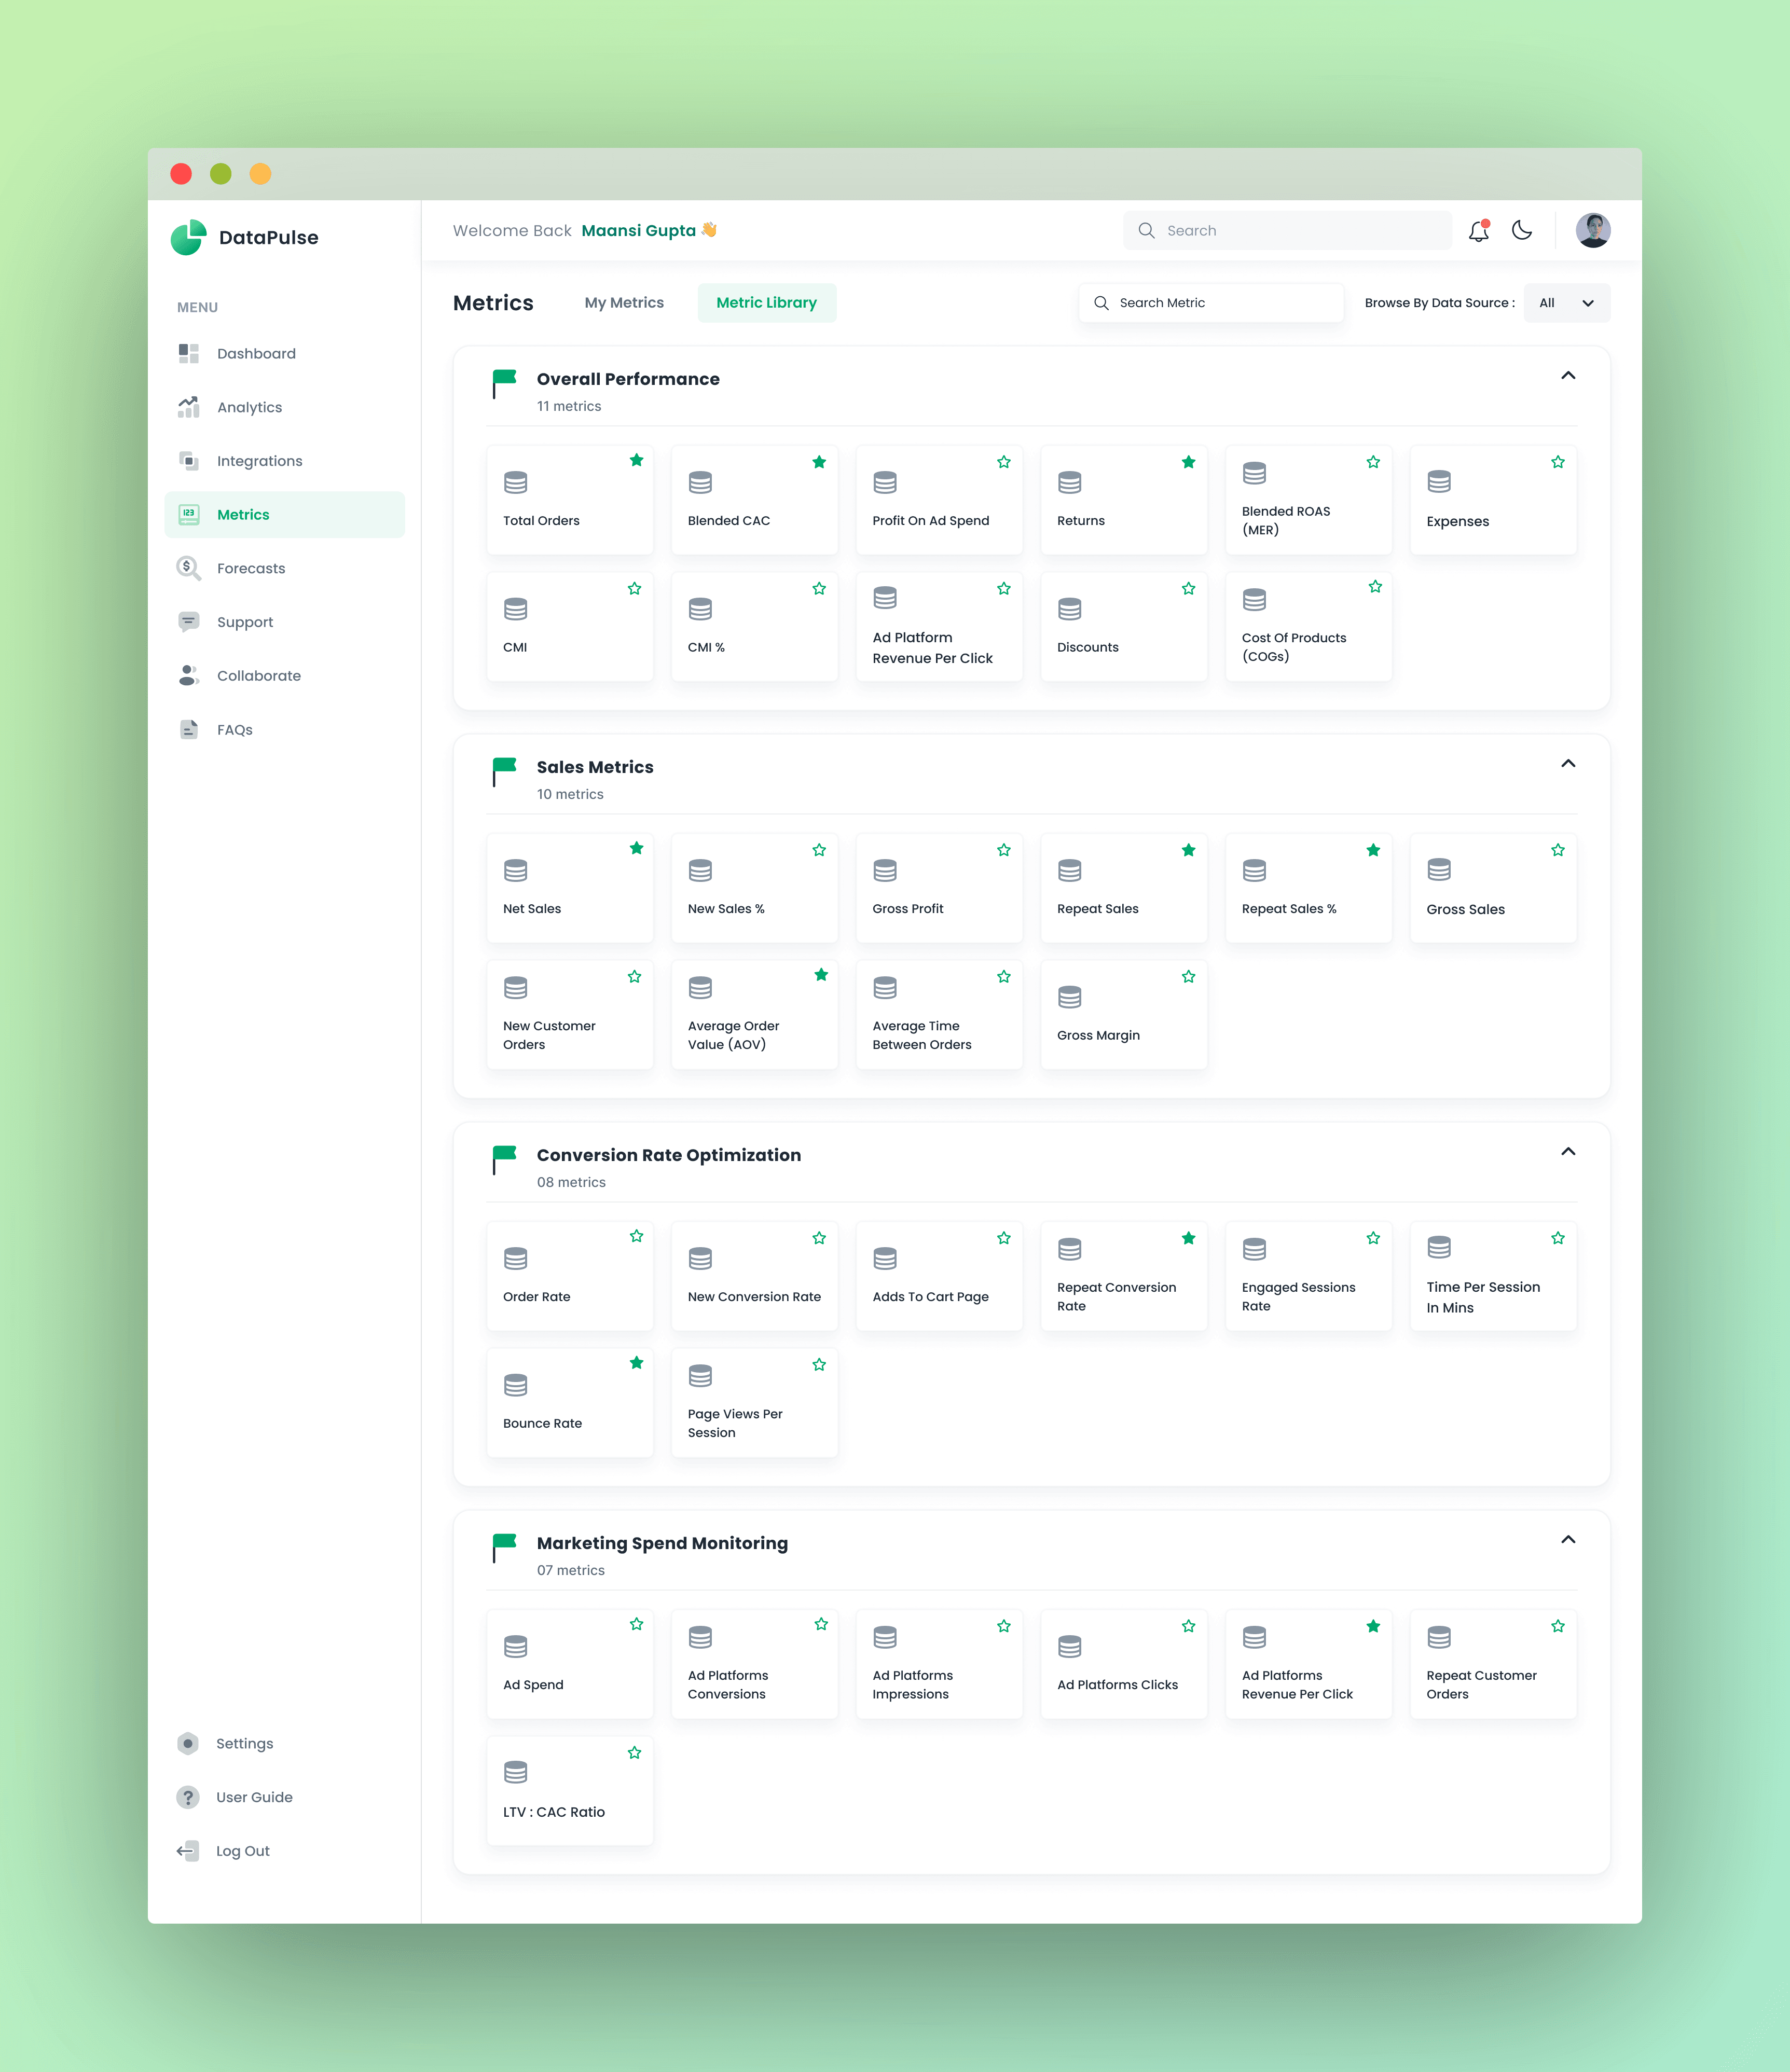
- 04Shipped a modular design system so new integrations slot in without redesigning a single screen
Results
What Results Did DataPulse Achieve?
Week 1
4
Core numbers agreed with the team - the questions that run the business, not the data that's available.
Month 1
1 view
Sales, spend, and profit together, replacing the Friday spreadsheet and five open tabs.
Ongoing
0
Screens redesigned to add a new integration - the system absorbs them.
Beyond the numbers, teams stopped asking "what happened?" and started asking "what do we do next?" - which is the only question analytics should ever leave you with.
Showcase
The work, up close
FAQ
Thinking about something like this?
DataPulse went from a Friday spreadsheet to a dashboard teams open first thing every morning - and it's built to grow with every integration they add.